pyHL7 aECG — HL7 Annotated ECG Export
A small Python module that exports an ECG recording to the HL7 v3 / FDA Annotated ECG (aECG) XML format — the format used to submit digital ECG data to the FDA in clinical trials.
Step 1Define
What It Had to Do
- FormatWrite an ECG lead out as an HL7 v3 / FDA aECG XML file
- LeadsHold any of the 12 standard leads, each with its own samples, resolution and units
- MetadataCarry the trial, subject, timepoint and device fields an aECG file expects
- EncodingStore the waveform the way aECG does: integer counts times a scale, in µV
- StackPython 3 and numpy only
Step 3Build
How the Export Works
You build an ECG object, load one or more of the 12 standard leads with their sample values, set the time and amplitude resolution, and call exportHL7aECGTemplate(). It writes a schema‑shaped aECG XML file containing:
- an
AnnotatedECGroot codedCPT‑4 93000("Electrocardiogram"); - trial / subject / timepoint metadata (clinical trial, trial subject, demographics, relative timepoint, device manufacturer and model);
- a
sequenceSetwith aGLIST_TStime sequence and anSLIST_PQwaveform sequence (origin,scale, and thedigitsstring).
On export the waveform is converted from mV to µV and divided by the amplitude resolution, because the aECG digits field carries integer counts that are multiplied back by scale.
Classes
LEAD | one lead: amplitude samples (+ resolution, unit) and time (resolution ↔ sampling frequency, unit) — setting one of the time fields updates the other. |
ECG | the 12 leads (I, II, III, aVR, aVL, aVF, V1–V6) plus the aECG metadata fields, with getters/setters and exportHL7aECGTemplate(path, leadName). |
Example
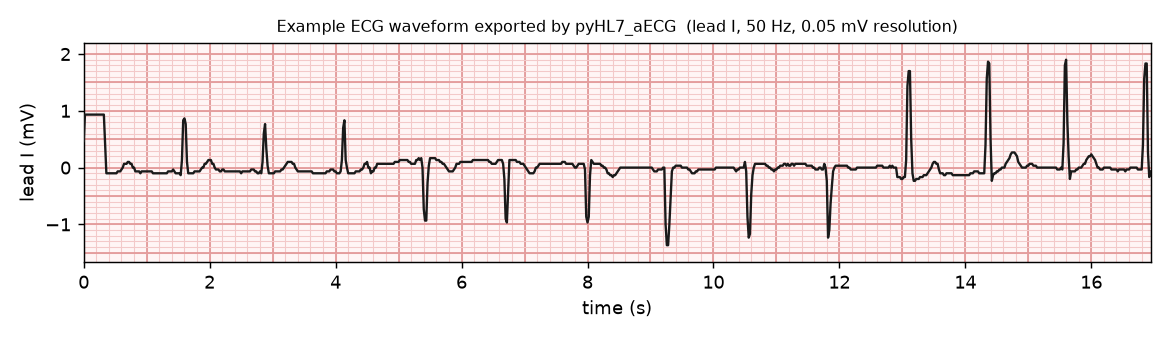
example.py fills lead I with a sample waveform, sets a 20 ms time resolution (50 Hz) and a 0.05 mV amplitude resolution, and writes output/ecg.xml:
The example lead‑I waveform that gets exported.
import ecg, numpy as np

e = ecg.ECG()
lead = e.getLead("I")
lead.setAmplitudValues(volt, "mV")   # volt: np.array of samples
lead.setTimeResolution(20)           # ms  -> 50 Hz
lead.setAmplitudResolution(0.05)     # mV
e.exportHL7aECGTemplate("output/ecg.xml", "I")
The output is HL7 v3 aECG, e.g. the waveform block:
<sequence>
  <code code="MDC_ECG_LEAD_I" codeSystem="2.16.840.1.113883.6.24" .../>
  <value xsi:type="SLIST_PQ">
    <origin value="0.000" unit="uV"/>
    <scale value="50.0" unit="uV"/>
    <digits>9 19 19 19 ...</digits>
  </value>
</sequence>
Caveats
- The XML is assembled by string templating, not validated against the aECG schema — run the output through an aECG validator before relying on it.
- One lead per
exportcall; the ID / time / subject / device fields default to the sample values baked intoECG.__init__and should be set for real data. - Amplitude values are mutated in place during export — pass a copy to keep the originals.
Step 5Refine
Where It Went Next
The module became the export layer of the ECG digitization service. Its ECG and LEAD classes were carried into ecg.py in that project’s ECGLibrary package with the existing code unchanged, and three export methods were added beside exportHL7aECGTemplate(): exportLeadMAT(), which writes a MATLAB .m script that plots the lead; exportLeadJSON(); and exportIWFDB(), which writes a PhysioNet WFDB record. After digitizing a lead the library calls all four, which is where the service’s JSON, WFDB, MATLAB and HL7‑aECG result formats come from.
Posted In:
Embedded Software